
Working with Charts and Graphs in Illustrator
About Tutorial
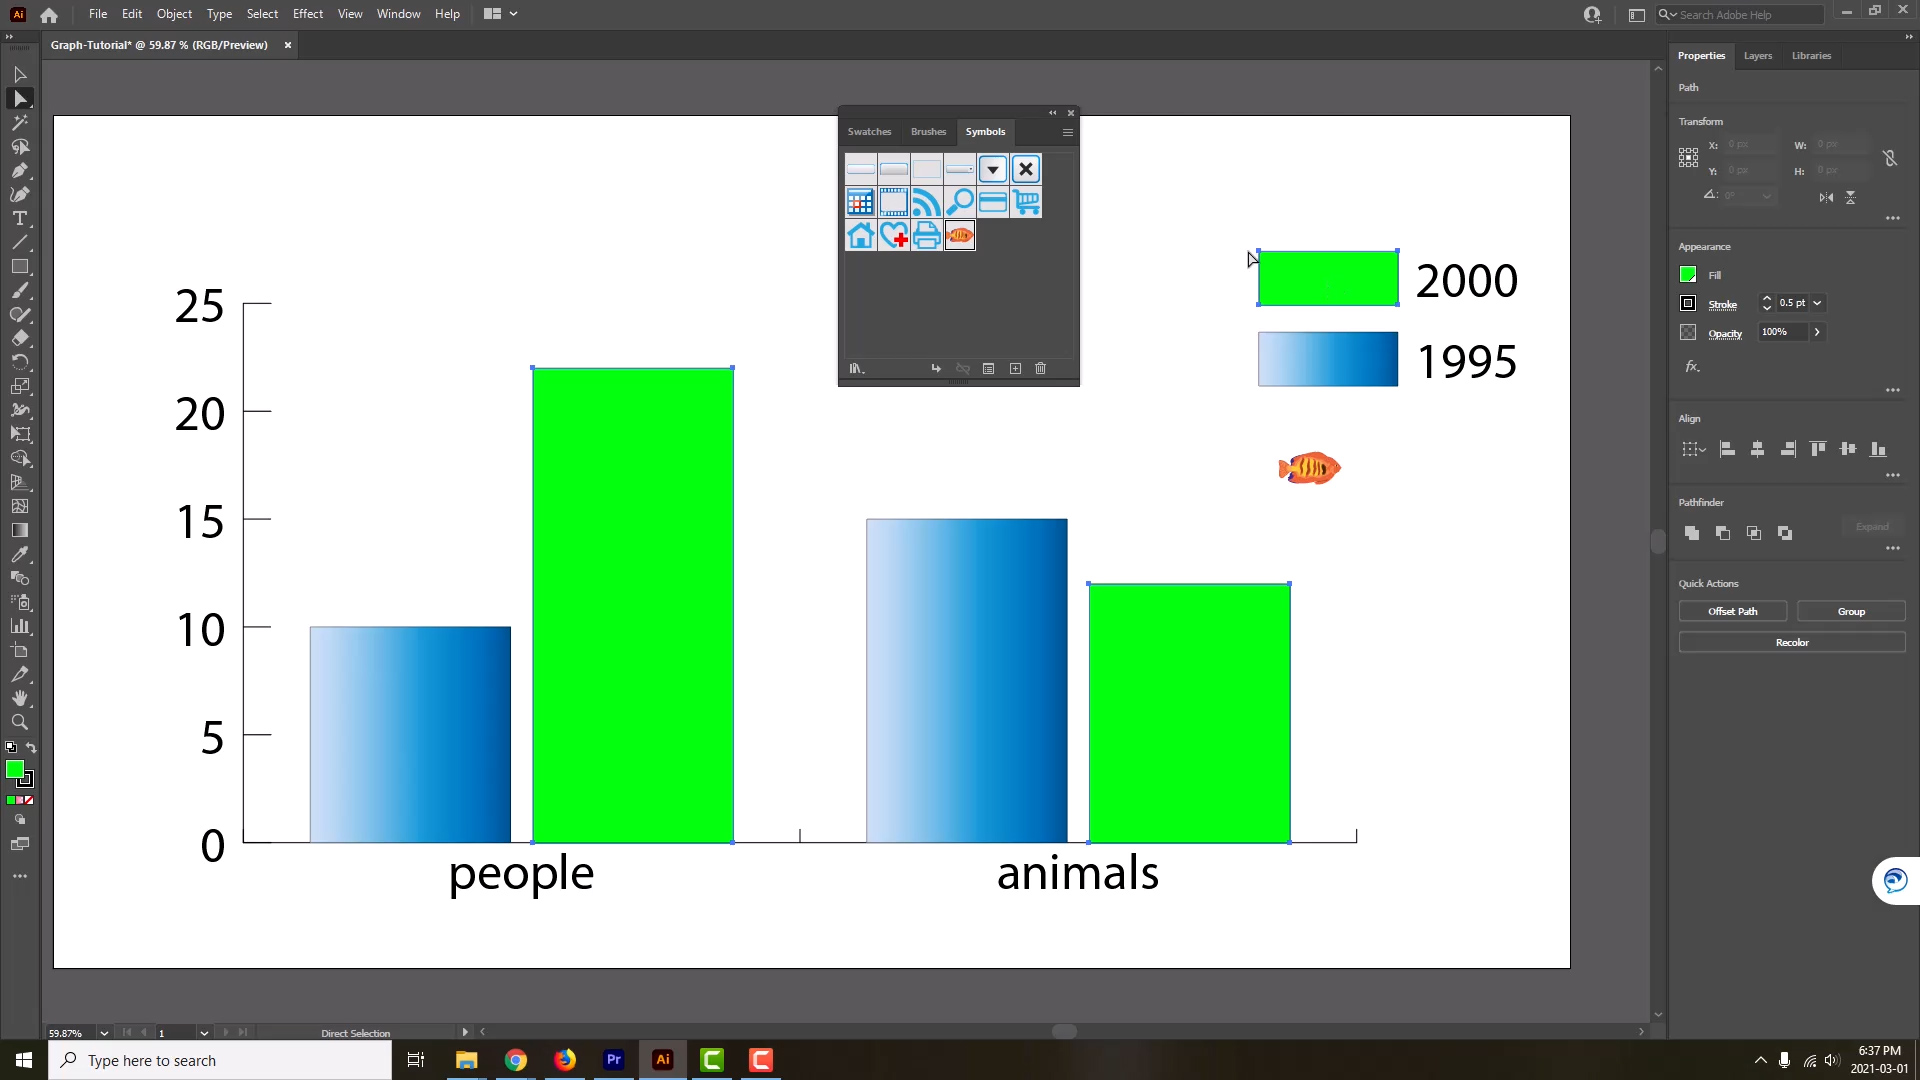
This tutorial provides a walkthrough for creating, customizing, and integrating vector graphics using Adobe Illustrator and InDesign. Learners will first discover how to generate a variety of data-driven charts and graphs directly within Illustrator, followed by techniques for customizing their appearance and visual styling. Finally, the tutorial demonstrates how to seamlessly import these graphics into InDesign, ensuring dynamically linked workflows so any design changes update automatically across your project.
Produced, Written & Directed by: Daniela Olariu & Lindsay Hanna
Post-Production Coordination & Editor: Daniela Olariu
Graphics & VFX: Victoria Learn
Tutorial Content
Modules
-
Creating Charts and Graphs in Illustrator
-
Customizing Charts and Graphs in Illustrator
-
Placing Illustrator Files in InDesign